Abstract//
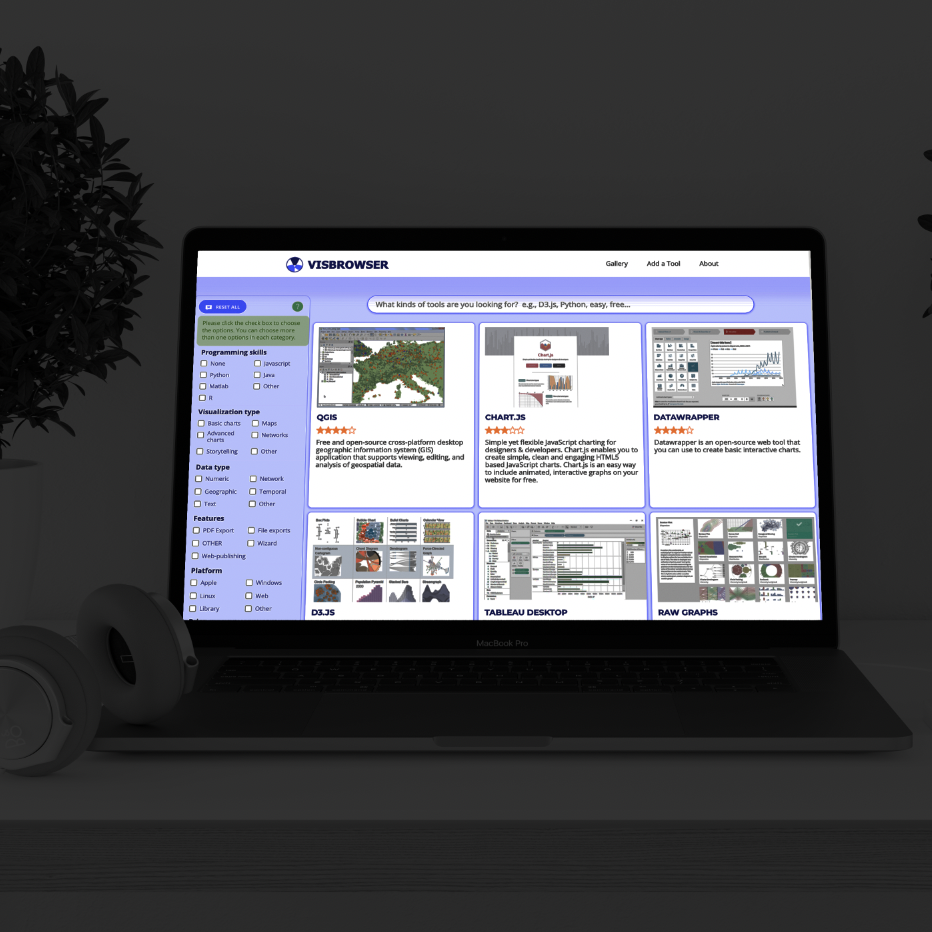
Data visualisation tools, as the integral assistants to help understand and analyse data, are emerging and developing rapidly. With the wide variety of these tools, it is burdensome for data visualization tool-users to navigate this landscape. To solve this problem, a browser-based online collection of data visualisation tools called VisBrowser was developed in a prior project. However, the previous version of VisBrowser has not yet been evaluated and it is not known whether it does help users to find the data visualisation tools they need. This study aims to understand the behaviours and needs of present VisBrowser users who try to find a tool by searching and browsing, and to evaluate and improve the web user experience(UX) of the previous version of VisBrowser.
Mixed-method user research was adopted; a total of 30 participants responded to the web UX questionnaire and six of them took part in semi-structured interviews. An online concurrent think-aloud (CTA) method was used in remote interviews. This method is rarely used remotely but has achieved valid results in this research. Based on user research, the improved version of VisBrowser was designed and implemented from scratch. A new feature called ‘Gallery’ was added to the application to allow users to upload and view examples of data visualisations, which could inspire users to explore the landscape of data visualisation tools. In addition, the new version of the VisBrowser was evaluated by users and adjustments have been made in light of their feedback.